Heart Rate Drift for Runners: Measure Durability Without a Lab

Heart rate drift is the gradual rise in heart rate during prolonged steady exercise, even when pace or power stays flat. Small amounts of drift are a normal response to sustained effort, while large drift usually points to heat, dehydration, or an unplanned increase in relative intensity. The most useful next step is to measure decoupling on a standardized steady session, which tells you whether your drift is ordinary physiology or something to actually address.
TL;DR:
- Run a steady 60 to 90 minute Zone 2 session, split it evenly, and compare pace or power relative to heart rate.
- Coaches often use roughly 5% and 10% as practical benchmarks, not clinical cutoffs; heat, humidity, dehydration, terrain, poor sleep, fatigue, or sensor errors can raise a score independently of fitness.
- In one controlled cycling study, body mass losses from sweating of about 1% and 3% were associated with heart rate increases of about 10 and 18 beats per minute; individual responses vary.
- Repeat tests every few weeks on the same route, at a similar time, and in comparable weather; log sleep and hydration to interpret changes.
- Use heart rate ceilings on easy days in hot weather, but prescribe intervals and threshold work by pace or power, not heart rate.
Table of Contents
- What cardiac drift and aerobic decoupling actually mean
- What causes heart rate to climb during steady efforts
- How to run a field test for heart rate drift
- Reading your decoupling number: benchmarks and context
- Practical ways to manage drift during training
- Using decoupling trends to guide training decisions
- What the research says about cardiovascular drift
- How SnapHRZones supports your drift testing
- FAQ
- Sources
What cardiac drift and aerobic decoupling actually mean
These two terms get used interchangeably, but they describe different things, and mixing them up leads to muddled training decisions.
Cardiovascular drift is the physiological pattern itself: heart rate climbs while stroke volume falls, typically starting after around ten to twenty minutes of steady moderate exercise, and becoming more pronounced the longer the effort continues, according to a review of cardiovascular drift during heat stress. It happens inside the body regardless of whether anyone is tracking it.
Aerobic decoupling, sometimes written as Pa:HR (pace to heart rate) or Pw:HR (power to heart rate), is a field metric. It compares your output in the first half of a workout to your output in the second half, relative to heart rate, so you can quantify how much drift showed up in that specific session.
- Cardiovascular drift: the internal physiology, useful for understanding why HR rises.
- Aerobic decoupling: the practical number you calculate afterward, useful for tracking durability over weeks and months.
A runner holding a steady pace for an extended period with heart rate climbing significantly is experiencing drift. Calculating the percentage change between the first and second half of that run turns the observation into a decoupling score you can compare across sessions.
What causes heart rate to climb during steady efforts
Several mechanisms contribute to drift, and most of them point back to the same root cause: your body is managing heat while still trying to deliver blood to working muscles.
As core and skin temperature rise during sustained exercise, more blood gets redirected to the skin to help dissipate heat. That redistribution reduces the blood returning to the heart, which lowers stroke volume, the amount of blood pumped per beat. Heart rate then climbs to compensate and keep cardiac output steady, a pattern summarized in a review of cardiovascular drift during heat stress. Fluid loss also plays a role: in a 1991 lab study, replacing fluid during prolonged exercise reduced the rise in heart rate and the fall in stroke volume. Some researchers also point to a filling-time effect: as heart rate rises, the ventricles have less time to fill between beats, which can further limit stroke volume and feed the cycle.
Hydration status plays a measurable role on top of thermoregulation.
A study on exercise-induced hypohydration found that heart rate rose by approximately 10 to 18 beats per minute depending on the degree of body mass loss from sweat—around one to three percent—with stroke volume dropping correspondingly, according to research on hypohydration and cardiovascular drift. That was a small controlled laboratory study (nine people cycling at a fixed moderate intensity in a 21 °C room), so the figures show the direction and rough size of the effect under those conditions, not a fixed response everyone will see. Even mild fluid loss appears to nudge heart rate upward during steady work, and larger deficits tend to amplify the effect.
Other contributors worth knowing about:
- Glycogen depletion and fatigue late in long sessions can add to the cardiovascular strain.
- Heat and humidity set the environmental ceiling for how much drift you are likely to see on a given day.
- Stimulants and some medications can elevate heart rate independent of effort.
- Optical wrist sensors sometimes produce drift-like artifacts that are not physiological at all, so a chest strap is the more dependable choice when you are specifically trying to quantify drift.
One safety note: a heart rate rise during steady, familiar effort is usually benign, but a rise that feels disproportionate to effort, especially alongside dizziness, chest discomfort, or unusual shortness of breath, warrants medical attention rather than training interpretation.
How to run a field test for heart rate drift
Quantifying decoupling takes one structured workout and a bit of arithmetic. Running the test under consistent conditions is what makes the number meaningful over time.
- Control the variables first. Use the same route or trainer setup, similar time of day, normal sleep and fueling, and consistent clothing across repeat tests. A chest strap gives more reliable heart rate data than most optical wrist sensors when you are trying to isolate drift rather than sensor noise.
- Warm up, then hold a steady effort for 60 to 90 minutes. Runners typically target an easy Zone 2 pace; cyclists can hold steady power. Minimize stops, traffic lights, and major terrain changes.
- Split the session into two equal halves and calculate the average pace (or power) and average heart rate for each half separately.
- Calculate the decoupling percentage. For each half, divide your average speed by your average heart rate to get an efficiency factor (EF), then use: ((EF first half − EF second half) / EF first half) × 100.
- Repeat under similar conditions every few weeks to build a trend rather than relying on one test.
The ratio uses speed (distance per time, such as meters per minute), not pace (minutes per mile or kilometer). Speed rises as you run faster, so a higher EF means more output per heartbeat. This follows the TrainingPeaks approach, which compares first-half and second-half EF; for running, TrainingPeaks calculates EF from Normalized Graded Speed (speed adjusted for terrain) divided by heart rate. The example below uses plain average speed as an accessible simplified calculation, so it will not exactly reproduce TrainingPeaks figures, especially on hilly or uneven runs.
Here is a worked example. Say you hold 180 meters per minute (about 5:33 per kilometer) for the whole run. In the first half your heart rate averages 140 bpm, so EF = 180 ÷ 140 = 1.286. In the second half it averages 150 bpm, so EF = 180 ÷ 150 = 1.200. The decoupling is ((1.286 − 1.200) / 1.286) × 100 ≈ 6.7%. If your speed also changes between halves, use each half’s own average speed. That single number is far more actionable than “my heart rate went up a bit.”
Many training platforms calculate Pa:HR automatically once you upload a steady session, which saves the manual math. When a platform does not offer this, the formula above takes only a few minutes with a spreadsheet.
Pro Tip: Log the weather, your hydration status, and how you slept alongside every decoupling test, since those confounders can explain much of the variation between tests.
Before you run the test, it helps to estimate a sensible easy range. A quick look at how to calculate your Zone 2 range gives you a starting target; check it against the talk test, since percentage-based zones are estimates.
Reading your decoupling number: benchmarks and context
Once you have a percentage, the next question is what it actually tells you.
Coaches commonly treat a score under about 5% as a good sign of aerobic durability for that session and above about 10% as a reason to look more closely. These are practical coaching benchmarks, not universal clinical or physiological cutoffs, and what is typical depends on session length and how steady the effort was. A high score can reflect heat, dehydration, hilly terrain, fatigue, or a sensor problem as much as fitness, so one score cannot diagnose a weak aerobic base.
These benchmarks only mean something in context.
- Easy, long aerobic sessions are where decoupling is most informative, since threshold or tempo efforts naturally produce higher heart rate responses that muddy the comparison.
- A hot or humid day can inflate decoupling even for a well-trained athlete, since cardiovascular drift is tied to rising relative metabolic intensity in heat, independent of fitness level.
- Poor sleep or incomplete recovery from a prior hard session can also push the number higher than it would be on a fresh day.
If a single test produces an outlier, the more useful response is to note the conditions and retest under more typical circumstances rather than overreacting to one data point. Tracking decoupling across several tests on the same route, at a similar time of day, and under comparable weather gives a far clearer signal than any individual session.
Practical ways to manage drift during training
A few adjustments, applied consistently, tend to keep drift closer to its lower end without requiring complicated planning.
Hydration is the most direct lever. Starting a long session well hydrated and drinking at regular intervals during efforts beyond an hour helps limit the hypohydration-driven heart rate rise described earlier, though exact volumes vary by sweat rate, body size, and conditions, so general ranges rather than fixed prescriptions make more sense for most people.

Cooling matters almost as much. Lightweight, breathable clothing, dousing with water during hot efforts, and even brief pre-cooling before a session in warm weather can blunt how much core temperature climbs, which in turn limits the cardiovascular compensation that drives drift.
Pacing strategy also shapes what you observe:
- Hold pace or power steady when the goal is to measure drift honestly, letting heart rate float as the outcome.
- Hold heart rate steady instead on hot days when the priority is finishing comfortably rather than testing durability, accepting that pace or power will naturally fall.
- Fuel adequately during long sessions, since glycogen depletion compounds fatigue-related heart rate rise late in a workout.
- Prioritize sleep and recovery in the days before a benchmark test, since incomplete recovery inflates decoupling independent of aerobic fitness.
Pro Tip: When testing drift specifically, use a chest strap rather than a wrist-based optical sensor, since wrist sensors are more prone to motion artifacts that can mimic or mask real drift.
Using decoupling trends to guide training decisions
Decoupling is most useful as a planning tool once you look at it across weeks rather than as a one-off score.
Heart rate targets can quietly mislead you in the heat. Because rising core temperature pushes heart rate up independent of actual output, a session prescribed by heart rate alone can end up at a lower real workload than intended on a hot day, even though the number on your watch looks “on target.” This is part of why cardiovascular drift correlates with increased relative metabolic intensity during heat stress: the same heart rate can represent different physiological strain depending on conditions.
A few rules of thumb help translate this into practice:
- Favor pace or power targets over heart rate targets for interval and threshold work, where precise intensity matters more than a drifting heart rate number.
- Reserve heart rate targets for easy aerobic days where staying below a ceiling matters more than hitting an exact pace.
- Treat an improving decoupling trend (lower percentages over successive standardized tests) as one encouraging indicator; decide on more volume or intensity together with recovery, training history, any symptoms, and other performance measures.
- Treat a worsening trend as a cue to check conditions, recovery, and sensor data, and to consider extending aerobic base work before layering on harder sessions.
The guiding principle is to react to trends across several standardized tests, not to a single number from one session, since weather, sleep, and fueling all introduce noise that a single test cannot separate from genuine fitness change.
What the research says about cardiovascular drift
The physiological mechanisms behind drift are reasonably well established in exercise science, though most of the controlled work comes from lab settings with heat exposure, which differs from everyday training conditions.
Researchers commonly attribute much of the drift to thermoregulatory demand (rising core temperature, more blood directed to the skin and a fall in stroke volume), while controlled studies show that dehydration also contributes; in the 1991 study above, fluid replacement largely prevented drift during prolonged exercise. Later studies tied that same pattern to measurable drops in VO2max and increases in relative metabolic intensity when exercise occurred in heat, per research linking drift to reduced maximal oxygen uptake. More recent modeling work has explored correcting for instantaneous heart rate drift to improve real-time intensity estimates, though this remains proof-of-concept rather than something built into most consumer devices yet, according to a recent heart rate-drift correction model.
Cardiovascular drift during prolonged exercise in the heat is associated with reductions in maximal oxygen uptake and an increase in relative metabolic intensity.
That finding is a reasonable basis for taking large drift seriously on hot days, but it does not mean every instance of drift signals a problem. Applied practically, the lab findings support a simple takeaway: treat drift as context-dependent information, not a verdict on fitness, and lean on standardized field tests to track your own trend over time.
How SnapHRZones supports your drift testing
Running a decoupling test starts with a sensible target range for the steady effort. Our free Heart Rate Zone Calculator uses age-based formulas and an optional resting heart rate input to estimate your zones. Percentage-based zones are estimates: they may not match your individual LT1 or other thresholds, which require appropriate testing to identify. Use the estimate as a starting point and confirm the effort feels easy and conversational.
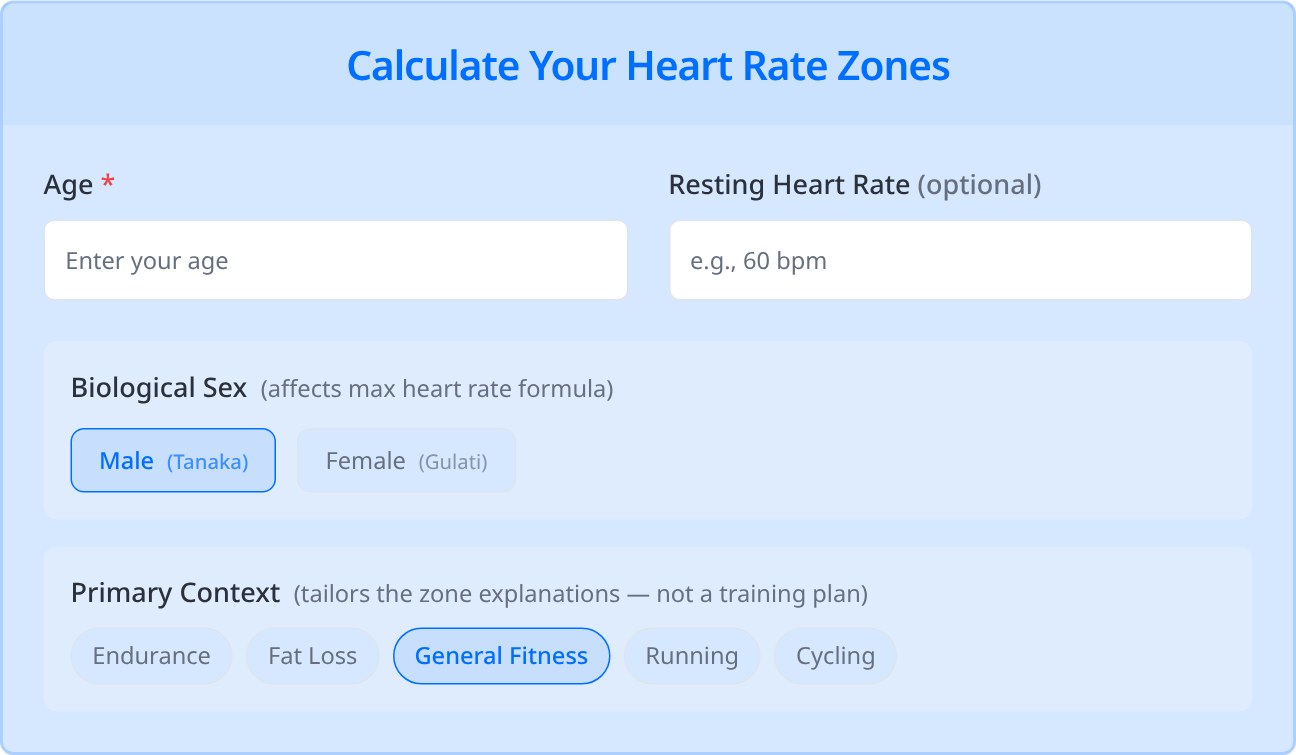
A few ways to put it to use alongside the protocol above:
- Estimate your zones first so your 60 to 90 minute test starts at an easy, steady effort rather than drifting into tempo effort from the start.
- Recheck your zones periodically, since resting heart rate and fitness shift over a training block.
- Log your decoupling percentage after each standardized test alongside the zone range you used, building a trend you can revisit alongside recovery and other measures.
Estimating your zones takes a couple of minutes, and using the same target range each time keeps your decoupling tests comparable.
FAQ
How much cardiac drift is normal?
There is no universal cutoff. As a practical coaching benchmark, decoupling under about 5% on a long, steady session is often read as good aerobic durability, 5% to 10% as developing, and above 10% as worth a closer look. Interpret any score in light of duration, heat, hydration, terrain, and sensor reliability, and look at trends rather than a single session.
Is 170 bpm bad when exercising?
A heart rate that feels high is not inherently bad. It depends entirely on your personal maximum heart rate and current training zone, which is why calculating your own zone 2 and higher-intensity ranges matters more than comparing against a fixed number.
Why does my decoupling score change from run to run?
Heat, humidity, hydration, sleep, prior fatigue, terrain, stops, and heart rate sensor errors all affect the result. Repeat the test on the same route, at a similar time, and in comparable conditions, and compare trends rather than single scores.
How do I fix cardiovascular drift?
Drift cannot be eliminated entirely since it is a normal part of prolonged exercise physiology, but hydrating before and during long efforts, dressing for heat, and building a stronger aerobic base through consistent easy training tend to reduce its magnitude. Comparing heart rate trends against HRV-based recovery signals can also help you tell whether a high-drift day reflects heat and fatigue rather than a fitness problem.
Sources
- Fluid replacement and glucose infusion during exercise prevent cardiovascular drift (J Appl Physiol, 1991)
- Hypohydration causes cardiovascular drift without reducing blood volume
- TrainingPeaks: Aerobic Decoupling (Pw:Hr and Pa:Hr) and Efficiency Factor (EF)
- Cardiovascular drift is related to reduced maximal oxygen uptake during heat stress
- Proof-of-concept model for instantaneous heart rate-drift correction during low and high exercise exertion
Recommended
Find your personal heart rate zones
Enter your age to get all five training zones in seconds.
Open the heart rate zone calculator