Heart Rate Recovery: Compare Readings at the One Minute Mark

Heart rate recovery at one minute (HRR1) is your heart rate at the end of exercise minus your heart rate 60 seconds later. In clinical exercise-testing research, a drop of 12 beats per minute or fewer at that one-minute mark was linked to higher mortality risk, while faster recovery tends to go with better fitness and autonomic function. That threshold came from specific test protocols and is not a home diagnostic cutoff. For self-monitoring, the most useful approach is measuring HRR1 the same way every time and watching your own trend rather than fixating on a single session.
TL;DR:
- HRR1 = heart rate at the end of exercise − heart rate 60 seconds later; keep activity, effort, posture, and active or passive recovery consistent.
- The classic 12 bpm threshold comes from clinical treadmill testing with a specific cool-down protocol; it is not a diagnosis and does not transfer directly to home workouts.
- Compare readings only after similar workouts: sleep loss, illness, dehydration, caffeine, medications, and exercise intensity can shift results without reflecting lasting fitness changes.
- Build aerobic training gradually and cool down for five to ten minutes. Discuss persistent unusual trends with a clinician; chest pain, fainting or severe breathlessness need urgent help.
Table of Contents
- What HRR Measures and the Physiology Behind It
- How to Calculate and Measure HRR Reliably
- Benchmarks: Normal, Good, and Concerning HRR Values
- What Influences HRR: Short-Term vs Long-Term Factors
- Evidence-Backed Ways to Improve Heart Rate Recovery
- Limits and Alternatives: Reproducibility, HRR AUC, and HRV
- When to Seek Medical Advice and How Clinicians Use HRR
- Track Trends and Tools: How SnapHRZones Helps You Monitor HRR
- Try SnapHRZones Calculators and Logging Tools
- FAQ
- Sources
What HRR Measures and the Physiology Behind It
When you stop exercising, your heart rate does not fall because your heart simply “slows down” on its own. Two nervous system branches drive the change. The sympathetic nervous system, which revved things up during exercise, starts to withdraw, and the parasympathetic (vagal) system reactivates and pulls heart rate back down. This happens in two phases: a fast drop in the first 30 to 60 seconds driven largely by vagal reactivation, followed by a slower decline over the next several minutes as sympathetic withdrawal and other factors continue to lower heart rate toward baseline.
A quicker first-minute drop generally reflects stronger parasympathetic tone and tends to track with better cardiorespiratory fitness and autonomic control, according to research linking HRR to cardiovagal modulation. Fitter individuals in these studies tend to show faster recovery, though the relationship between HRR and other autonomic measures is not always consistent across populations.
A few things are worth keeping in mind before you read too much into one number:
- HRR reflects autonomic nervous system behavior, not a direct measure of heart muscle strength or disease.
- It works best as one piece of a larger picture that can include heart rate variability (HRV) and baroreflex sensitivity (BRS).
- A single low reading does not diagnose a problem; it is a signal worth tracking over time, not a verdict.
Because HRR is influenced by so many overlapping systems, it is best treated as a useful fitness and wellness indicator rather than a standalone clinical test.
How to Calculate and Measure HRR Reliably
Getting a number you can actually trust depends more on your measurement process than on your fitness level. Small inconsistencies in timing or posture can shift your HRR by several beats, which makes session-to-session comparison meaningless unless you lock down your method.
Here is a simple, repeatable protocol:
- Define your starting reading clearly. Use your heart rate at the exact moment you stop the main effort (usually your peak for that effort), not after you’ve already started slowing down or walking it off.
- Start your timer immediately. The moment you stop, begin counting to 60 seconds. A few seconds of delay changes the result.
- Record your heart rate at exactly 60 seconds. HRR1 = heart rate at the end of exercise − heart rate 60 seconds later.
- Stay consistent with active versus passive recovery. Active recovery (such as slow walking) keeps heart rate somewhat higher, while passive recovery (standing, sitting or lying down) usually lets it fall faster. Posture matters too, so pick one approach and use it every time.
- Log the result the same way each session so you can compare apples to apples over weeks and months.
Cleveland Clinic’s guidance on HRR stresses checking heart rate right when you finish the most intense part of your workout, not at the end of a cool-down. Test intensity matters as well: a near-maximal effort, a moderate tempo run and an easy jog produce different end-of-exercise heart rates and different recovery curves, so compare only similar efforts.
If you do not have a chest strap or wrist-based optical sensor, manual pulse counting works, but count for a full 15 seconds and multiply by four rather than estimating from a shorter window. Wrist-based optical sensors can lag during rapid heart rate changes immediately after intense effort, so a chest strap tends to give a more responsive reading in the first minute of recovery.
Common errors to avoid: stopping your timer late, changing your recovery posture between sessions, comparing HRR from a treadmill session to HRR from a cycling session, and treating one unusual reading as a trend.

Pro Tip: Measure HRR after a workout that feels similarly hard each time, like your weekly tempo run, so your comparisons track real changes in recovery rather than differences in effort.
Benchmarks: Normal, Good, and Concerning HRR Values
Interpreting your HRR number depends heavily on how it was measured. The best-known reference point comes from Cole et al. (1999), which followed 2,428 adults referred for symptom-limited treadmill testing with thallium imaging at Cleveland Clinic. In that protocol, a fall of 12 beats per minute or fewer in the first minute was defined as abnormal. It was associated with about four times the risk of death in unadjusted analysis and about twice the risk after adjusting for age, fitness, medications and other factors.
The 12 bpm threshold is a research and clinical exercise-testing marker, not a universal home-training cutoff. It was derived in a specific patient population, after a specific test, with a specific cool-down. Other studies using different protocols and time points found different cutoffs; for example, Shetler et al. (2001) found that recovery at two minutes predicted mortality best in their population, with a cutoff of 22 bpm. A number just above or below 12 after a home workout does not carry a dramatically different meaning, and Cleveland Clinic notes there isn’t one magic number for everyone.
Beyond that threshold, a few general patterns are worth knowing:
- Fitter people often recover faster, but there is no validated universal “good” or “normal” HRR1 range for home workouts, because results depend on protocol, effort and the individual.
- Recovery continues after the first minute, so two-minute readings are often larger than one-minute readings.
- Lower exercise intensity, non-maximal effort, or incomplete warm-ups can all produce smaller, less meaningful HRR readings.
- Age and baseline fitness both shift what counts as a “typical” number for a given person, so comparing your HRR to a training partner’s is rarely useful.
Exercise type matters too. Running can produce different HRR values than cycling or rowing for the same person, partly because of differences in muscle mass involved and heat load. This is one more reason to keep your measurement method and activity type consistent when tracking your own trend instead of comparing across modalities or against generic population averages.
What Influences HRR: Short-Term vs Long-Term Factors
Not every change in your HRR reflects a real shift in fitness or health. Separating noise from signal starts with recognizing which factors move the number temporarily and which ones shape it over months.
Short-term factors that can shift a single reading include:
- Alcohol in the hours before exercise, which can affect hydration, heart rate and coordination. Skipping hard training after drinking is the cautious choice; if you are weighing whether to work out the next day, Recover 365 has a guide on how to train safely after drinking. Either way, don’t compare an HRR reading taken after drinking with your usual trend.
- Poor sleep the night before, which tends to blunt recovery markers generally.
- Dehydration or high caffeine intake close to your workout.
- A recent cold, flu, or other illness, even after symptoms fade.
- Time of day, since autonomic tone shifts somewhat across the day.
- Skipping a proper warm-up or cool-down, which can distort both peak and recovery readings.
- Changing your recovery posture between sessions, such as sitting one day and standing the next.
Longer-term influences include your overall aerobic fitness level, your age, certain medications (particularly beta-blockers, which blunt heart rate responses broadly), and underlying cardiac conditions. Clinical commentary on recovery physiology frames HRR as a marker of how efficiently the body shifts from sympathetic to parasympathetic dominance, which is precisely the kind of system that both training and chronic conditions can reshape over time.
The practical takeaway is to standardize what you can control, same time of day, same warm-up, same recovery posture, and then watch your numbers over weeks rather than reacting to any single session.
Evidence-Backed Ways to Improve Heart Rate Recovery
Improving HRR is largely about training the same aerobic systems that improve fitness generally, with a few targeted recovery techniques layered on top.
The clearest evidence comes from cardiac rehabilitation research. A systematic review of exercise-based cardiac rehab programs found pooled improvements in HRR of around 5.35 beats per minute in patients with coronary artery disease, though the review noted substantial variation between individuals. That figure comes from a clinical population working with structured, supervised programs, so it illustrates what consistent aerobic training can do rather than a guarantee for every person starting from a healthy baseline.
A practical, graduated approach:
- Build a consistent aerobic base with steady-state sessions at a conversational pace several times a week.
- Add interval work gradually, such as short periods of harder effort followed by easier recovery, once a base is established.
- Prioritize a real cool-down instead of stopping abruptly, which AHA guidance recommends lasting around 5 to 10 minutes.
- Layer in breathing or relaxation practices post-workout if you find them helpful for winding down.
- Be cautious about cold water immersion claims. A meta-analysis of recovery techniques found that cold water immersion after exercise increased RMSSD, an HRV marker, more than other techniques, with effects varying by exercise type. HRV and HRR1 are different measures, so these findings do not show that cold water immersion improves your one-minute heart rate recovery or your long-term HRR trend.
- Increase training load progressively and build in rest weeks to avoid the fatigue that can blunt recovery markers rather than improve them.
If you are structuring aerobic work specifically to support this kind of adaptation, a lactate threshold heart rate calculator can help you set intensity zones that build an aerobic base without constantly training too hard to recover well between sessions.
Pro Tip: Progress is usually measured in weeks, not days. Give any new training or recovery habit at least four to six weeks before judging whether your HRR trend has actually shifted.
Limits and Alternatives: Reproducibility, HRR AUC, and HRV
HRR is useful, but it has real measurement limitations worth understanding before you put too much weight on any single number. Reproducibility research has found that single-point measures like HRR1 (at one minute) and HRR2 (at two minutes) can vary considerably across different exercise modalities and intensities, which limits how confidently you can compare a treadmill result one week to a cycling result the next.
Some researchers have proposed using the area under the recovery curve, known as HRR AUC, which integrates the entire recovery trajectory rather than relying on a single point in time. This approach may offer better reproducibility than single-point readings, since it is less dependent on the exact peak heart rate reached, though it requires continuous monitoring rather than a quick manual check.
A few practical implications follow from this:
- Modality and intensity both matter: compare HRR only across sessions of similar type and effort level.
- Self-comparison under an identical protocol is more valuable than comparing your number to population averages or other people.
- HRV offers a complementary view of autonomic balance that some athletes track alongside HRR, since it captures beat-to-beat variation rather than a single recovery slope.
- A clinician-administered stress test remains the appropriate route when there is a specific medical concern, since it includes continuous monitoring, symptom assessment, and clinical interpretation that a home reading cannot replicate.
Treat your personal HRR trend as directionally useful information, not a precise clinical measurement.
When to Seek Medical Advice and How Clinicians Use HRR
Most day-to-day fluctuations in HRR are not cause for concern. It helps to separate three situations.
Get emergency help now (call 911 or your local emergency number) if, during or after exercise, you have chest pain, pressure or tightness, fainting or near-fainting, severe shortness of breath, or a racing or irregular heartbeat that does not settle with rest.
Get prompt medical evaluation if you have milder but new exercise-related symptoms, such as dizziness, unusual breathlessness or palpitations, even if they pass.
Book a routine, nonurgent conversation with a clinician if you notice, without symptoms:
- Consistently low HRR readings after similar hard efforts, measured the same way across several sessions.
- A persistent, unexplained decline in your HRR trend over several weeks despite stable training and sleep.
Clinical exercise stress testing, fitness self-monitoring and medical evaluation are different things. A home HRR reading is fitness self-monitoring: useful for spotting your own trends, but not a test result. Clinicians generally do not interpret HRR in isolation. In a clinical stress test setting, HRR is weighed alongside exercise capacity, symptoms during and after exertion, resting heart rate, and broader cardiovascular risk factors, since HRR reflects the shift between sympathetic and parasympathetic dominance that can be affected by many conditions beyond fitness alone.
If you are concerned about a pattern you are seeing, the most useful step is repeating your measurement under carefully controlled, consistent conditions and bringing a log of your readings, along with any device data, to your appointment. That context helps a clinician separate a measurement artifact from something that genuinely warrants further evaluation.
Track Trends and Tools: How SnapHRZones Helps You Monitor HRR
A single HRR reading tells you very little. The trend across weeks and months, measured the same way every time, is what actually reflects changes in your fitness and recovery capacity.
A simple logging workflow looks like this:
- Pick one activity type and one recovery posture, and stick with both for every measurement.
- Log your peak heart rate, your one-minute heart rate, and the resulting HRR after every comparable session.
- Review the trend every few weeks rather than reacting to any single data point.
Our heart rate zone calculators use your age and, optionally, your resting heart rate to generate personalized training zones, which helps you structure the kind of consistent aerobic work that supports better long-term recovery. Pairing a steady zone-based training plan with the measurement protocol above gives you a more complete picture than tracking HRR alone, since you are controlling both the training stimulus and the recovery measurement at the same time.
Try SnapHRZones Calculators and Logging Tools
We built our heart rate zone calculator to take the guesswork out of training intensity, using age-specific formulas and an optional resting heart rate input for a more personalized set of zones.
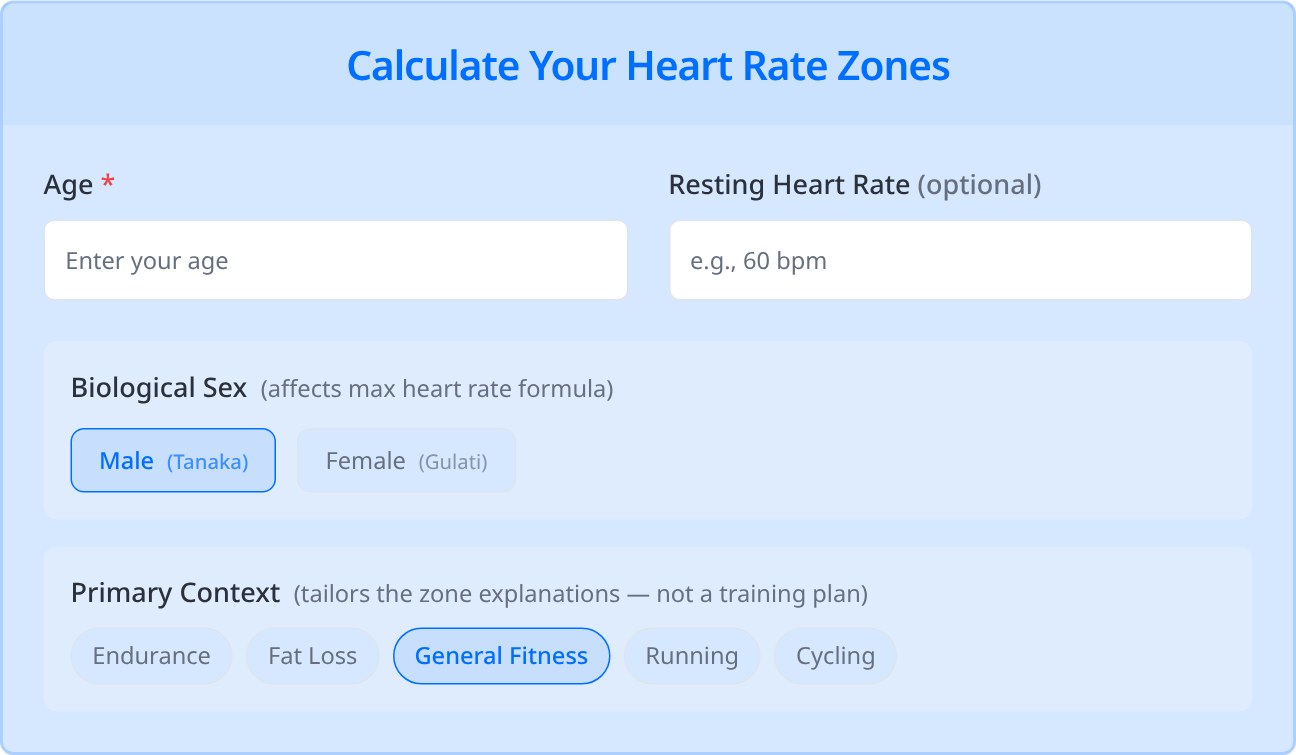
Pairing consistent zone-based training with a simple HRR logging habit gives you a clearer picture of your own progress than either one alone.
| What you get | Why it helps HRR tracking |
|---|---|
| Age-specific heart rate zones (see the AHA’s guide to building a physical activity plan) | Supports structured aerobic training |
| Optional resting heart rate input | Personalizes zones beyond a generic age formula |
| Free, instant calculation | Lets you re-check zones as fitness changes |
Calculate your training zones now and start logging your recovery trend alongside your workouts.
This article is general information, not a substitute for advice from a qualified doctor. Consult a qualified healthcare professional about your own circumstances before acting on anything here.
FAQ
How can I improve my resting heart rate?
Consistent aerobic exercise, adequate sleep, hydration, and stress management are the main levers most people can adjust to gradually lower a resting heart rate over time. Training in appropriate heart rate zones rather than always going hard tends to support this kind of adaptation more sustainably than sporadic intense workouts.
What are common causes of a slow heart rate?
A naturally slow resting heart rate is often simply a sign of good cardiovascular fitness, especially in trained athletes. It can also result from certain medications like beta-blockers, thyroid conditions, or less commonly, underlying issues with the heart’s electrical system, which is why a persistently very low or symptomatic heart rate is worth discussing with a doctor.
What is a normal resting heart rate for adults?
A typical resting heart rate for most adults falls within a broad range generally considered normal by clinical standards, though well-trained individuals often sit toward the lower end of that range. Factors like fitness level, age, medications, and stress all influence where a given person falls within that range.
What are common causes of a high heart rate?
A faster-than-usual heart rate can come from short-term factors like caffeine, dehydration, stress, fever, or recent intense exercise, all of which tend to resolve on their own. It can also reflect longer-term factors like low fitness, certain medications, or underlying cardiac or thyroid conditions, which is worth mentioning to a doctor if it persists at rest without an obvious cause.
Sources
- Heart rate recovery: What it is and how to calculate it — Cleveland Clinic
- Cole CR et al. Heart-rate recovery immediately after exercise as a predictor of mortality. N Engl J Med. 1999;341(18):1351–1357
- Shetler K et al. Heart rate recovery: validation and methodologic issues. J Am Coll Cardiol. 2001;38(7):1980–1987
- Manresa-Rocamora A et al. Exercise-based cardiac rehabilitation and parasympathetic function in patients with coronary artery disease: a systematic review and meta-analysis. Clin Auton Res. 2021;31:187–203
- Laborde S et al. Influence of physical post-exercise recovery techniques on vagally-mediated heart rate variability: a systematic review and meta-analysis. Clin Physiol Funct Imaging. 2024;44(1):14–35
- Warm-up and cool-down guidance — American Heart Association
Recommended
Find your personal heart rate zones
Enter your age to get all five training zones in seconds.
Open the heart rate zone calculator