Heart Diagram: Chambers, Valves and Blood Flow Explained

A heart diagram shows four chambers, four valves, the large vessels attached to them and the path blood takes through the heart, lungs and body. Read it in that order: chambers first, then valves, then vessels, then follow the arrows. Once you can do that, most other heart illustrations become much easier to read.
This guide walks through a standard diagram label by label, using a simplified labeled schematic. It then explains how the anatomy connects to exercise and to the heart rate you see on a watch, and where that connection stops.
Quick answer: How to read a heart diagram
- The heart has four chambers: two atria on top that receive blood and two ventricles below that pump it out.
- The right side sends oxygen-poor blood to the lungs. The left side sends oxygen-rich blood to the rest of the body.
- Four valves act as one-way gates between chambers and vessels, and the diagram’s arrows and colors show the direction of flow.
- Left and right on a diagram refer to the person’s body, not the viewer’s, so the heart can look mirrored.
- Colors show how much oxygen the blood carries, not whether a vessel is an artery or a vein.
Most diagrams show a heart cut open from the front. You see the chambers as four rooms, the valves as small flaps between them, and the vessels as tubes entering and leaving at the top and sides. Arrows trace the direction of blood flow, and color usually separates two kinds of blood: blue for oxygen-poor, red for oxygen-rich. The U.S. National Heart, Lung, and Blood Institute uses this kind of interior diagram with four chambers and color-coded blood in its public guide.
The detail that trips most people up is orientation. The “left” and “right” labels describe the body of the person the heart belongs to. A diagram is drawn as if you are facing that person, so their right side appears on your left. PBS NOVA points out that an illustration can look reversed because it depicts somebody else’s heart, and recommends following the arrows and the color coding rather than trusting your instinct about sides.
A quick routine helps:
- Find the labels “right” and “left” and remember they belong to the patient, not you.
- Locate the four chambers, two on top and two on the bottom.
- Find the vessels at the top of the picture and note which are blue and which are red.
- Follow the arrows from the blue vessels in, through the lungs, and out through the red ones.
Table of Contents
- Quick answer: How to read a heart diagram
- Labeled heart diagram
- The four chambers
- How blood travels through the heart
- The four heart valves
- The major blood vessels
- Heart wall and basic anatomy
- How the heart responds to exercise
- How heart anatomy connects to heart rate training
- Common mistakes when studying a heart diagram
- FAQ
- Sources
Labeled heart diagram
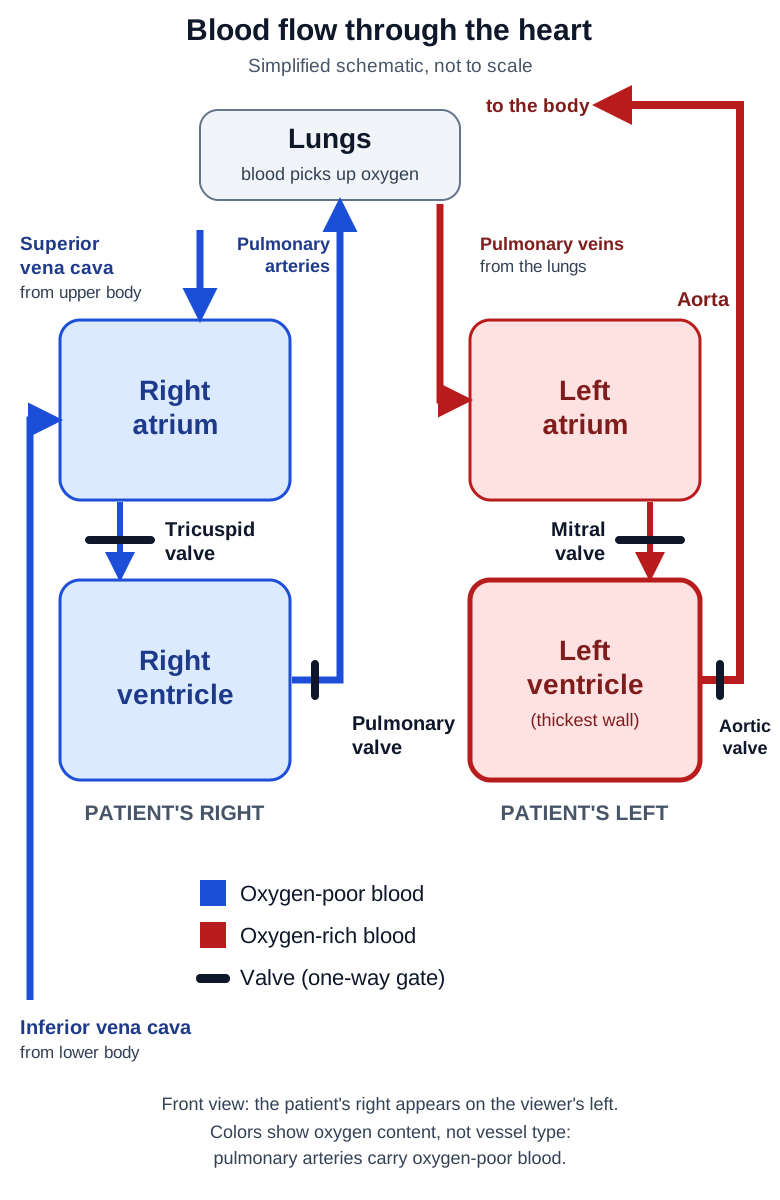
The photo at the top of this page shows a cut-away anatomical model. It is realistic, but it carries no labels. The schematic below is simplified on purpose: it is not drawn to scale and does not show the heart’s real shape or rotation in the chest, but it labels every structure this guide discusses and shows the direction of flow.
Open the labeled diagram full size
In the schematic:
- The patient’s right side, with the right atrium and right ventricle, is on the viewer’s left.
- The superior and inferior venae cavae bring oxygen-poor blood into the right atrium.
- The pulmonary arteries carry oxygen-poor blood to the lungs and are drawn in blue.
- The pulmonary veins return oxygen-rich blood to the left atrium and are drawn in red.
- The left ventricle pumps blood through the aortic valve into the aorta.
- The tricuspid, pulmonary, mitral and aortic valves are shown as bars at each one-way crossing.
The four chambers
The heart is divided into right and left halves, each with an upper and a lower chamber. NHLBI names them as the right atrium, right ventricle, left atrium and left ventricle, with atria receiving blood and ventricles pumping it out.
| Chamber | Position on the diagram | Receives blood from | Sends blood to |
|---|---|---|---|
| Right atrium | Upper left of the picture | Body, via the superior and inferior venae cavae | Right ventricle, through the tricuspid valve |
| Right ventricle | Lower left of the picture | Right atrium, through the tricuspid valve | Lungs, through the pulmonary valve and pulmonary arteries |
| Left atrium | Upper right of the picture | Lungs, via the pulmonary veins | Left ventricle, through the mitral valve |
| Left ventricle | Lower right of the picture | Left atrium, through the mitral valve | Body, through the aortic valve and aorta |
The positions in the table assume the usual front-facing view, where the patient’s right appears on the viewer’s left. The CDC’s guide to heart flow confirms the first step in that sequence: the right atrium receives oxygen-poor blood from the body and the right ventricle pumps it to the lungs.
A useful way to remember the division of labor is that the right heart serves the lungs and the left heart serves everything else. De Anza College’s physiology text describes the right side as pulmonary circulation and the left side as systemic circulation. On many diagrams the left ventricle’s wall is drawn visibly thicker than the right, which fits its role of sending blood to the whole body.
How blood travels through the heart
The arrows on a diagram are the most useful part, so it is worth reading them as one continuous sequence. NHLBI’s description of how blood flows through the heart gives the path, including every valve it passes:
Body → venae cavae → right atrium → tricuspid valve → right ventricle → pulmonary valve → pulmonary arteries → lungs → pulmonary veins → left atrium → mitral valve → left ventricle → aortic valve → aorta → body.
Step by step:
- Oxygen-poor blood returns from the body through the superior and inferior venae cavae into the right atrium.
- It passes through the tricuspid valve into the right ventricle.
- The right ventricle pumps it through the pulmonary valve into the pulmonary arteries, which carry it to the lungs.
- In the lungs, the blood picks up oxygen and releases carbon dioxide.
- Oxygen-rich blood returns through the pulmonary veins to the left atrium.
- It passes through the mitral valve into the left ventricle.
- The left ventricle pumps it through the aortic valve into the aorta, which carries it to the body.
Then the loop starts again. Notice that the only vessels that break the usual color rule are the pulmonary ones. The pulmonary arteries carry oxygen-poor blood and the pulmonary veins carry oxygen-rich blood. Diagrams color them by what the blood contains, not by whether the vessel is called an artery or a vein, which is a common source of confusion for students.
The four heart valves
Each crossing in that sequence passes through a valve. Valves open for forward flow and close to stop blood from leaking backward. The American Heart Association describes them as opening to let blood move forward and closing to prevent backward flow. Think of them as one-way gates.
NHLBI places each one:
- Tricuspid valve: between the right atrium and right ventricle.
- Pulmonary valve: between the right ventricle and the pulmonary artery.
- Mitral valve: between the left atrium and left ventricle.
- Aortic valve: between the left ventricle and the aorta.
These placements come from the same NHLBI blood flow page. A handy way to keep them straight: the two valves between the upper and lower chambers (tricuspid and mitral) are the entrances to the ventricles, and the two valves at the exits (pulmonary and aortic) lead out to the great vessels.
When a diagram is simplified, valves may be drawn as small triangles, leaflets or bars. If yours does not label them, look for the narrow points between the upper and lower chambers and at the base of the big vessels.
The major blood vessels
The large vessels connected directly to the heart are called the great vessels. Cleveland Clinic lists them as the aorta, main pulmonary artery, pulmonary veins, superior vena cava and inferior vena cava. The main pulmonary artery divides into the right and left pulmonary arteries, one for each lung. Here is what each carries, based on the NHLBI description:
| Vessel | Carries | Connects to |
|---|---|---|
| Superior vena cava | Oxygen-poor blood from the upper body | Right atrium |
| Inferior vena cava | Oxygen-poor blood from the lower body | Right atrium |
| Pulmonary arteries | Oxygen-poor blood to the lungs | Right ventricle, via the pulmonary valve |
| Pulmonary veins | Oxygen-rich blood from the lungs | Left atrium |
| Aorta | Oxygen-rich blood to the body | Left ventricle, via the aortic valve |
The aorta is the largest of these and usually appears as an arch at the top of the diagram, with branches rising from it. The coronary arteries, which feed the heart muscle itself, are often drawn as thin vessels on the heart’s surface. They are a separate set of labels from the great vessels and appear on more detailed diagrams.
Heart wall and basic anatomy
The heart lies between the lungs in the middle of the chest, behind the sternum and tilted slightly to the left. Cleveland Clinic describes it as sitting behind and slightly left of the breastbone, between the lungs. Anatomy texts call this region the mediastinum.
The heart wall has three layers, and good diagrams label them:
- Endocardium: the thin inner lining of the chambers and valves.
- Myocardium: the muscular middle layer that contracts to pump blood.
- Epicardium: the protective outer layer.
The Douglas College anatomy text lays out these layers and notes that the pericardium is a protective sac around the heart containing lubricating fluid. If you see a double-lined outline around the heart in a diagram, that is the pericardium.
The myocardium is the layer most relevant to exercise. It is the muscle that contracts with every beat, and it is thicker around the ventricles, especially the left ventricle, because they do the heavy pumping.
How the heart responds to exercise
During exercise, working muscles need more oxygen, so the heart moves more blood each minute. Several terms describe different parts of that response, and they are not interchangeable:
- Heart rate: how many times the heart beats per minute.
- Stroke volume: how much blood a ventricle ejects with each beat.
- Cardiac output: the total volume pumped per minute. Cardiac output = heart rate × stroke volume.
- Oxygen delivery: how much oxygen reaches the tissues, which depends on cardiac output and on how much oxygen the blood carries.
- Aerobic adaptation: the longer-term changes from training, in the heart, blood vessels and muscles, that improve how much oxygen can be delivered and used.
De Anza’s text explains that during exercise, heart rate and stroke volume rise, which increases cardiac output and blood flow to the muscles. The same source reports that cardiac output can rise to 20 or more quarts per minute during exercise, versus about 5 quarts per minute at rest. Those are general figures, and individual values vary with fitness, body size and age.
What training does to the heart
An American Heart Association scientific statement reports that endurance training improves maximal oxygen uptake through greater cardiovascular oxygen delivery and greater use of oxygen by muscle. The same statement notes that training commonly lowers heart rate at a given submaximal effort while stroke volume increases, so a person can work at higher loads with a lower heart rate at each submaximal level.
A small study published in Circulation followed 12 previously sedentary adults through one year of intensive endurance training. It found increases in maximal oxygen uptake, maximal cardiac output, stroke volume and the mass of both ventricles. The researchers also observed that right-ventricular volume increased progressively from the outset, while left-ventricular volume did not change significantly until six months. It was a small group and an intensive program, so treat it as an illustration of how the heart can adapt, not as a promise of what any one person will see. For how these heart changes fit together with adaptations in the lungs and muscles, see our guide to cardiovascular endurance.

How Heart Anatomy Connects to Heart Rate Training
Everything traced on the diagram is a single circuit: the right heart sends blood through the lungs, and the left ventricle drives it out to the body. As exercise gets harder, cardiac output rises, and heart rate is one of the two factors that produce it. That is why heart rate generally climbs with intensity and can be used as a practical indicator of effort. A heart rate monitor or watch measures heart rate only. It does not measure stroke volume, cardiac output or how efficiently the heart pumps, and a training zone does not either.
Heart rate training zones are bands of heart rate used to organize effort, usually based on an estimated or measured maximum heart rate or on heart rate reserve. Formulas give an estimate, not a measurement of your own maximum, and heart rate at a given effort also shifts with heat, hydration, sleep, caffeine and fatigue. For a practical look at how easy aerobic work fits into a season, this piece on aerobic base training covers the idea of building speed by slowing down.
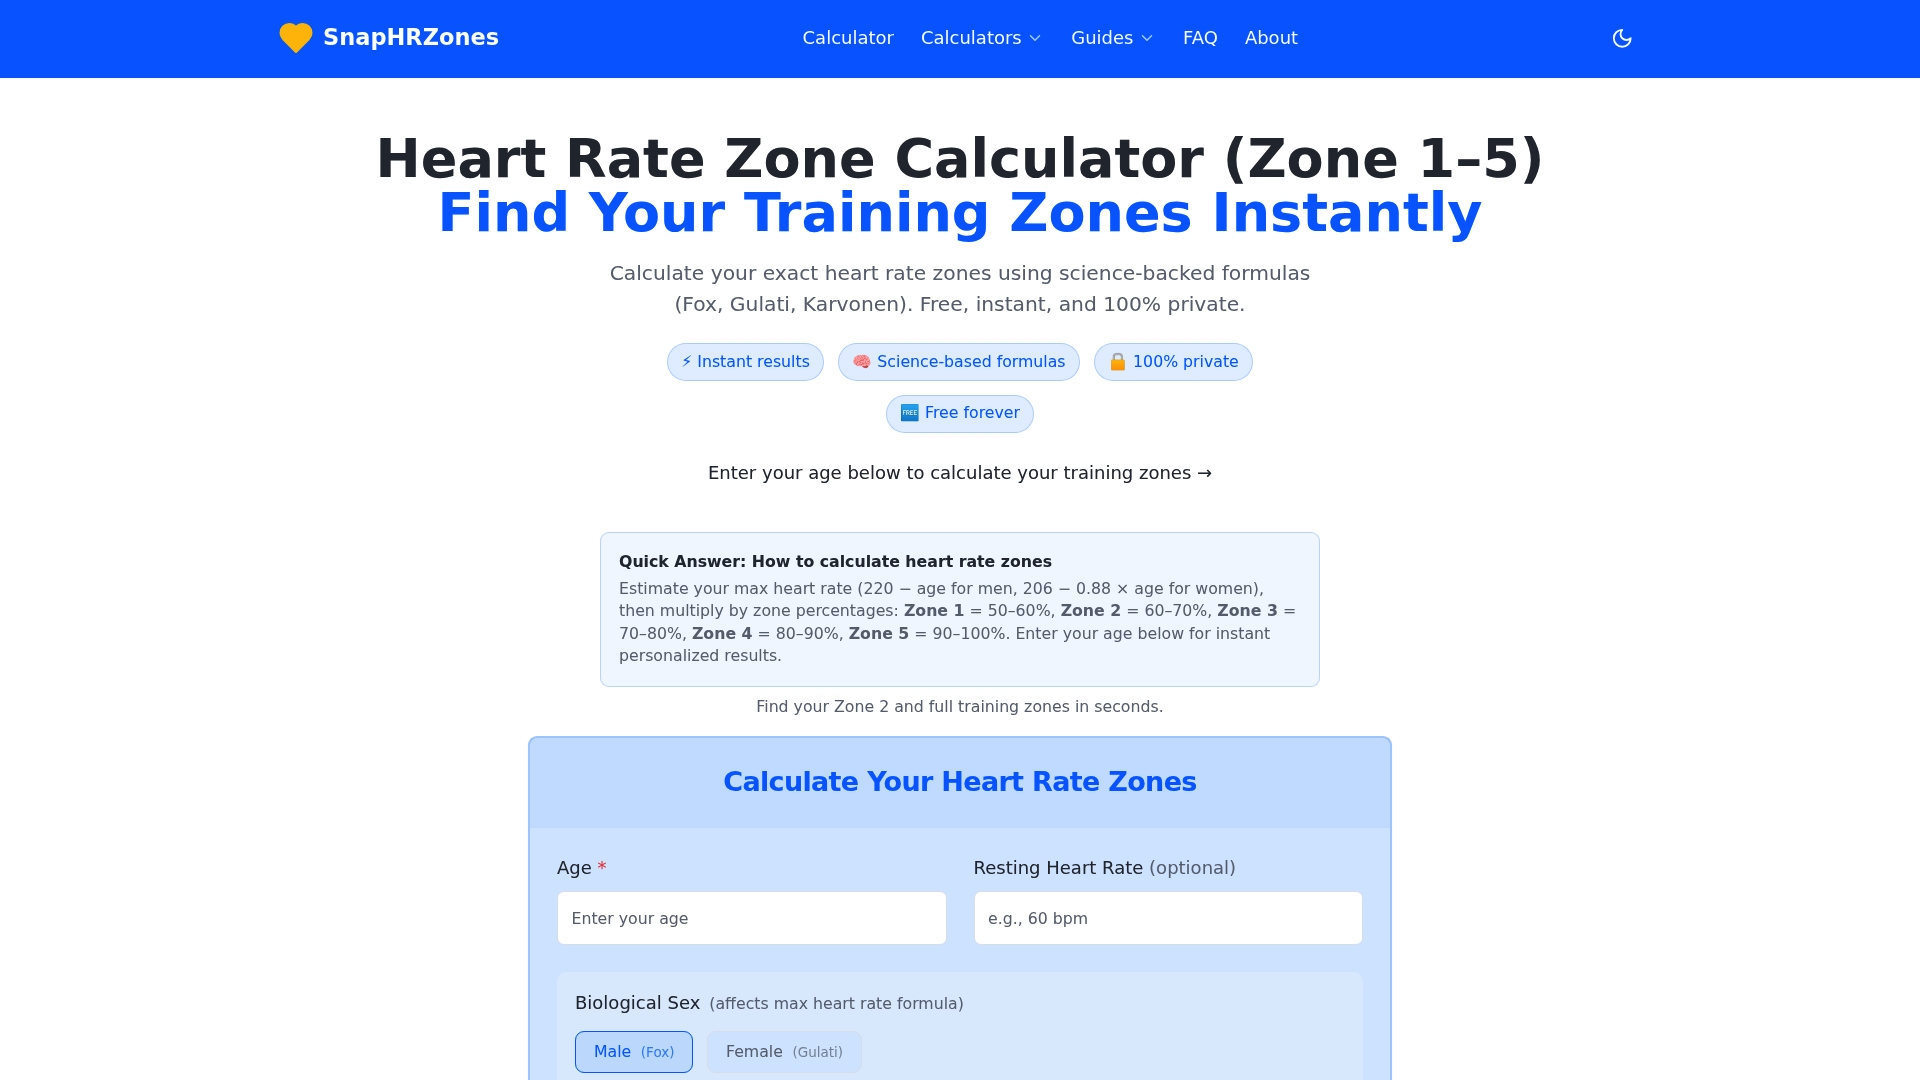
If you want to put numbers on your own training, the free Heart Rate Zone Calculator estimates zone ranges from your age, sex and optional resting heart rate, and our guide to heart rate zones explained describes what each zone is used for. If you have a known heart condition, take medication that affects heart rate, or notice chest pain, unusual breathlessness, dizziness or fainting during exercise, talk to your doctor before you rely on any zone number.
Common mistakes when studying a heart diagram
- Reading sides from your own point of view. The right atrium sits on the viewer’s left. Anchor yourself to the patient.
- Coloring by vessel name. Pulmonary arteries carry oxygen-poor blood and are usually blue, even though most arteries carry oxygen-rich blood.
- Skipping the valves. The valves explain why blood moves in one direction, so trace them in the flow rather than memorizing them as a list.
- Treating the diagram as exact. Textbook drawings and schematics simplify. Real hearts are rotated in the chest and the chambers overlap, so a 3D model can help.
- Ignoring the layers. The myocardium, the muscle that does the pumping, is easy to miss in a drawing that only shows the chambers.
FAQ
What are the main parts of a heart diagram?
A standard diagram labels four chambers (right and left atria, right and left ventricles), four valves (tricuspid, pulmonary, mitral and aortic) and the great vessels: the venae cavae, pulmonary arteries, pulmonary veins and aorta. Arrows and colors show the direction of blood flow and whether the blood is oxygen-poor or oxygen-rich.
Why is the left side of the heart on the right side of the picture?
Labels follow the patient’s body. The diagram is drawn as if the person is facing you, so their left side appears on your right. Following the arrows and color coding avoids the mix-up.
Which side of the heart is larger or stronger?
The left ventricle has the thickest muscular wall because it sends blood to the whole body, while the right ventricle sends blood only to the lungs. Anatomy texts show this difference in wall thickness on most labeled diagrams.
How does a heart diagram relate to heart rate zones?
The diagram shows the pump and its circuit. Heart rate is how often that pump beats, and cardiac output equals heart rate times stroke volume. Heart rate zones use heart rate as a practical indicator of effort, but a heart rate monitor does not measure stroke volume, cardiac output or pumping efficiency.
Sources
- How the Heart Works: What the Heart Looks Like | NHLBI, NIH
- How the Heart Works: How Blood Flows through the Heart | NHLBI, NIH
- Map of the Human Heart Guide | NOVA | PBS
- How the Heart Works | CDC
- Heart Valves and Circulation | American Heart Association
- Heart: Anatomy & Function | Cleveland Clinic
- Great Vessels of the Heart | Cleveland Clinic
- 19.1 Heart Anatomy | Douglas College Human Anatomy and Physiology
- Cardiovascular and Respiratory System | De Anza College
- AHA Scientific Statement on exercise standards
- Cardiac Remodeling in Response to 1 Year of Intensive Endurance Training | Circulation
Recommended
Find your personal heart rate zones
Enter your age to get all five training zones in seconds.
Open the heart rate zone calculator